Sign In And Check Operator, Server, And Web
Use the console as the main workflow entry. Before creating resources, confirm the three control-plane components and their responsibilities.
Components
| Component | Responsibility | Troubleshooting Entry |
|---|---|---|
disaster-operator | Watches CRDs and executes backup, restore, sync, failover, and drill state machines | Pod logs, CRD status, Kubernetes Events |
disaster-server | REST APIs, Watch APIs, authentication, statistics, and DTO aggregation | Server logs, browser Network tab, OpenAPI |
disaster-web | Web console that calls server APIs | Browser console, Network tab, Service exposure |
Access The Console
Use NodePort or port-forwarding:
http://<NodeIP>:30087
http://127.0.0.1:8087
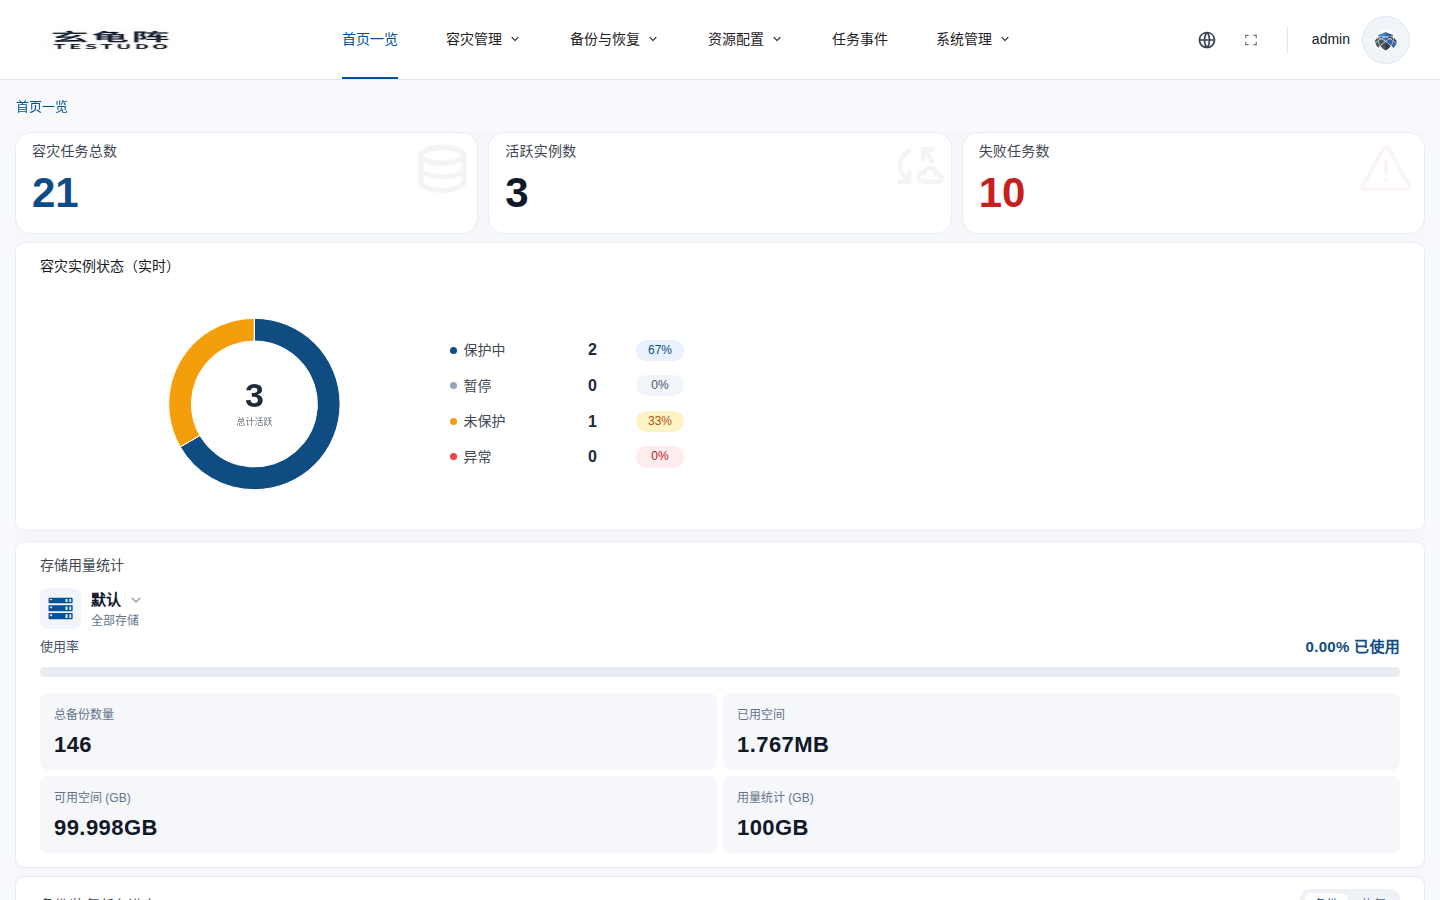
After sign-in, check the dashboard.
Kubernetes Checks
kubectl get deploy,pods,svc -n disaster-system
kubectl get crd | grep testudo.softcdata.com
kubectl get events -n disaster-system --sort-by=.lastTimestamp
If objects are created but no progress happens, inspect operator logs. If pages load but APIs fail, inspect server logs and browser Network requests.